pg_stat_activity is one of the system views of PostgreSQL. This view is very helpful to know what’s going on. With pg_stat_activity, you can know:
- How many queries are running in the same time
- Long running queries
- Which query holds lock
- Connection’s host
=# \d pg_stat_activity
                      View "pg_catalog.pg_stat_activity"
      Column      |           Type           | Collation | Nullable | Default
------------------+--------------------------+-----------+----------+---------
 datid            | oid                      |           |          |
 datname          | name                     |           |          |
 pid              | integer                  |           |          |
 leader_pid       | integer                  |           |          |
 usesysid         | oid                      |           |          |
 usename          | name                     |           |          |
 application_name | text                     |           |          |
 client_addr      | inet                     |           |          |
 client_hostname  | text                     |           |          |
 client_port      | integer                  |           |          |
 backend_start    | timestamp with time zone |           |          |
 xact_start       | timestamp with time zone |           |          |
 query_start      | timestamp with time zone |           |          |
 state_change     | timestamp with time zone |           |          |
 wait_event_type  | text                     |           |          |
 wait_event       | text                     |           |          |
 state            | text                     |           |          |
 backend_xid      | xid                      |           |          |
 backend_xmin     | xid                      |           |          |
 query            | text                     |           |          |
 backend_type     | text                     |           |          |
You can get process id and see what application it is and what query it is running, and the event it is waiting, and the state of connections.
-- Total Connections
SELECT COUNT(1) FROM pg_stat_activity
;

-- idle
SELECT COUNT(1) FROM pg_stat_activity WHERE state = 'idle'
;
-- order by when the connection started
SELECT * FROM pg_stat_activity ORDER BY backend_start
;

-- order by when the transaction started
SELECT * FROM pg_stat_activity ORDER BY xact_start
;

-- order by when the query started
SELECT * FROM pg_stat_activity ORDER BY query_start
;
SELECT state, wait_event, wait_event_type, COUNT(*)
FROM pg_stat_activity
GROUP BY 1, 2, 3
ORDER BY wait_event
;

 state  |     wait_event      | wait_event_type | count
--------+---------------------+-----------------+-------
        | AutoVacuumMain      | Activity        |     1
        | BgWriterHibernate   | Activity        |     1
        | CheckpointerMain    | Activity        |     1
 idle   | ClientRead          | Client          |     2
 idle   | Extension           | Extension       |     5
        | Extension           | Extension       |     1
        | LogicalLauncherMain | Activity        |     1
        | WalWriterMain       | Activity        |     1
 active |                     |                 |     1
SELECT datname,
       COUNT(*) AS open_connections,
       COUNT(*) FILTER (WHERE state = 'idle') AS idle_connections,
       COUNT(*) FILTER (WHERE state = 'idle in transaction') AS idle_in_transaction,
       COUNT(*) FILTER (WHERE state = 'active') AS active
FROM pg_stat_activity
GROUP BY ROLLUP(1)
;
and state could be these values:
from postgresql.org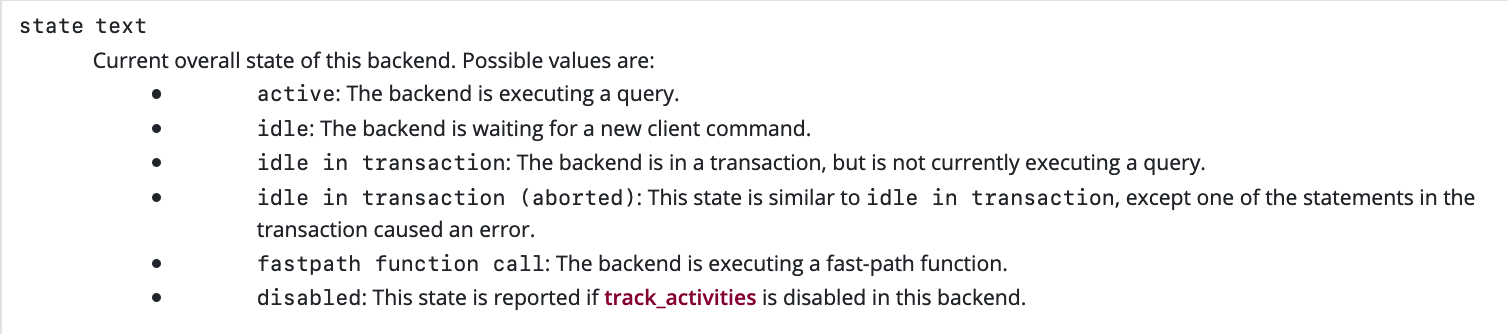
SELECT datname,
       pid,
       usename,
       application_name,
       xact_start,
       query,
       (now() - xact_start)::interval(3) AS duration
FROM pg_stat_activity
WHERE (now() - xact_start)::interval > '15 sec'::interval
;
SELECT pg_locks.locktype,
       pg_class.relname,
       pg_locks.pid,
       pg_locks.mode,
       pg_stat_activity.query
FROM pg_locks
LEFT OUTER JOIN pg_stat_activity ON pg_locks.pid = pg_stat_activity.pid
LEFT OUTER JOIN pg_class ON pg_locks.relation = pg_class.oid
WHERE NOT pg_locks.granted
ORDER BY pg_locks.pid DESC
;
and here are all attributes from relevant documentations:
pg_locks.locktype text
Type of the lockable object: relation, extend, frozenid, page, tuple, transactionid, virtualxid, spectoken, object, userlock, or advisory.

pg_class.relname name
Name of the table, index, view, etc.

pg_locks.pid int4
Process ID of the server process holding or awaiting this lock, or null if the lock is held by a prepared transaction

pg_locks.mode text
Name of the lock mode held or desired by this process

pg_stat_activity.query text
Text of this backend's most recent query. If state is active this field shows the currently executing query. In all other states, it shows the last query that was executed. By default the query text is truncated at 1024 bytes; this value can be changed via the parameter track_activity_query_size.

pg_stat_activity.pid integer
Process ID of this backend

pg_locks.relation oid (references pg_class.oid)
OID of the relation targeted by the lock, or null if the target is not a relation or part of a relation

pg_class.oid oid
Row identifier

pg_locks.granted bool
True if lock is held, false if lock is awaited